About ScaleOut Active Caching
Introduced with version 6 of the ScaleOut Product Suite™, ScaleOut Active Caching™ adds powerful new features for embedding C# or Java application code within ScaleOut’s distributed cache. Users can deploy message modules that process event messages targeted to specific cached objects and received from messaging hubs like Kafka or AWS SQS. They can also deploy API modules that define object-oriented APIs callable from client systems for performing application-specific actions on cached objects. Both types of modules enable customized cache accesses that accelerate performance, reduce network overhead, and avoid the complexity of serverless functions.
ScaleOut Active Caching provides a new UI that enables users to deploy and manage modules. This UI dramatically simplifies the creation of application-specific modules by allowing them to be dynamically embedded in a live distributed cache instead of compiled and linked into the cache’s source code. Using the UI, IT managers can easily track which modules are running and the workload they are handling at all times.
Charting and Querying Cached Data
Managers can use ScaleOut Active Caching’s management UI to continuously aggregate and visualize cached, JSON-encoded data in live charts, and they can query objects within a namespace for display in tables or maps. This powerful capability lets users monitor changes to cached data in real-time. This gives managers of live systems immediate insights that they can act upon (“operational intelligence”) to address emerging problems or capture new and possibly fleeting opportunities.
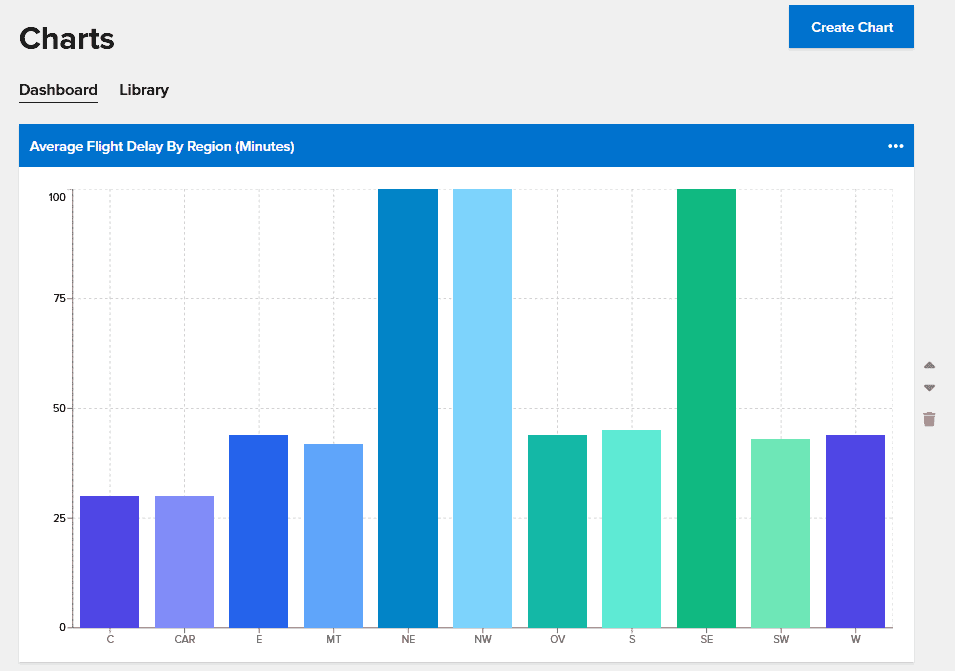
Charts aggregate data across all objects within a namespace by filtering it based on property values and combining it using another property’s value. They use a standard MapReduce algorithm that runs in parallel across all caching servers and refreshes the results every 7-10 seconds. For example, if a namespace held objects holding live data for airports in the U.S., a chart could show the average flight delay by region for airports where the daily passenger volume is over a desired threshold and the airport is experiencing weather delays.
The following chart shows the average flight delay in minutes for regions of the U.S. Note that three regions (NE, NW, SE) are experiencing higher than normal delays of 100 minutes:
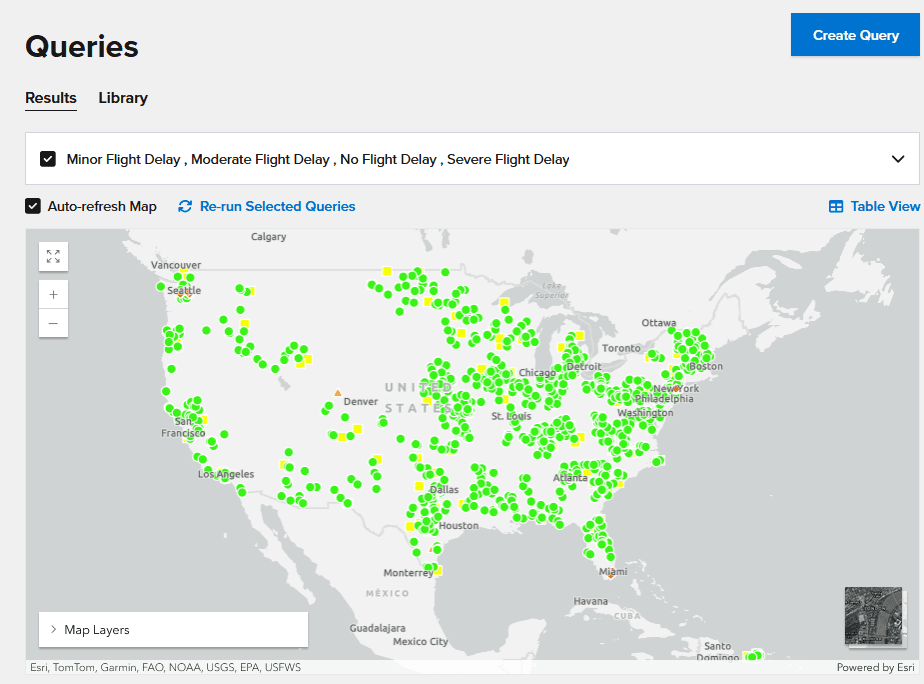
Queries display selected properties for cached objects within a namespace based on filters defined by property values. If latitude and longitude properties are supplied within the objects, query results can be displayed on a map instead of in tabular form. Like charts, continuous queries refresh their results every 7-10 seconds. Following the above example, a query could show the number of flights currently delayed and the number cancelled for all airports where the average delay is greater than 3 hours.
The following mapped query shows a color-coded severity level for flight delays at various airports. By hovering over an airport, the user can display queried properties, such as the current average flight delay:
In both examples, the results displayed could change rapidly. Having live information like this immediately accessible to managers enables them to evaluate changing conditions and take action when necessary. The distributed cache is not just a fast storage layer; it is a source of intelligence about live data.
Adding Gen AI to Charts and Queries
The challenge in creating charts and queries is that they must be specified to the management UI in a technical structure that resembles a database query. Objects are filtered by specifying constraints on properties described using “where” clauses, which are combined using Boolean operators into enclosing clauses that can in turn be combined with Boolean operators. Charts also specify the property used to group data and the operator used for combining data within a group, and queries list the properties to be displayed.
For example, a relatively simple chart for flight delays could be specified with parameters like these:
- select: average_flight_delay
- combine by: region
- combining operator: average
- where daily_passenger_volume >100000 AND weather_delays > 0
The process of specifying charts and queries can be time-consuming for non-technical users, and this can make it awkward to refine specifications when results are needed quickly. To address this challenge, ScaleOut Active Caching has integrated the OpenAI large language model into its management UI and provides the ability for users to create charts and queries with natural language prompts submitted to a built-in AI Assistant. Using training information provided by the UI, the LLM interprets the prompt and returns a fully formatted chart or query specification back to the UI for display.
For example, in the airport example, the user could type:
“Show me the average flight delay by region of the country for all airports with a passenger volume greater than 100000 that are experiencing weather delays.”
Because a prompt can be specified in many ways and still be correctly interpreted by the LLM, the user does not waste time formatting requests using a single rigid query specification. The LLM automatically maps natural language prompts into property values and operators with surprising accuracy. This allows users to see the results and then easily refine their requests with follow-on prompts.
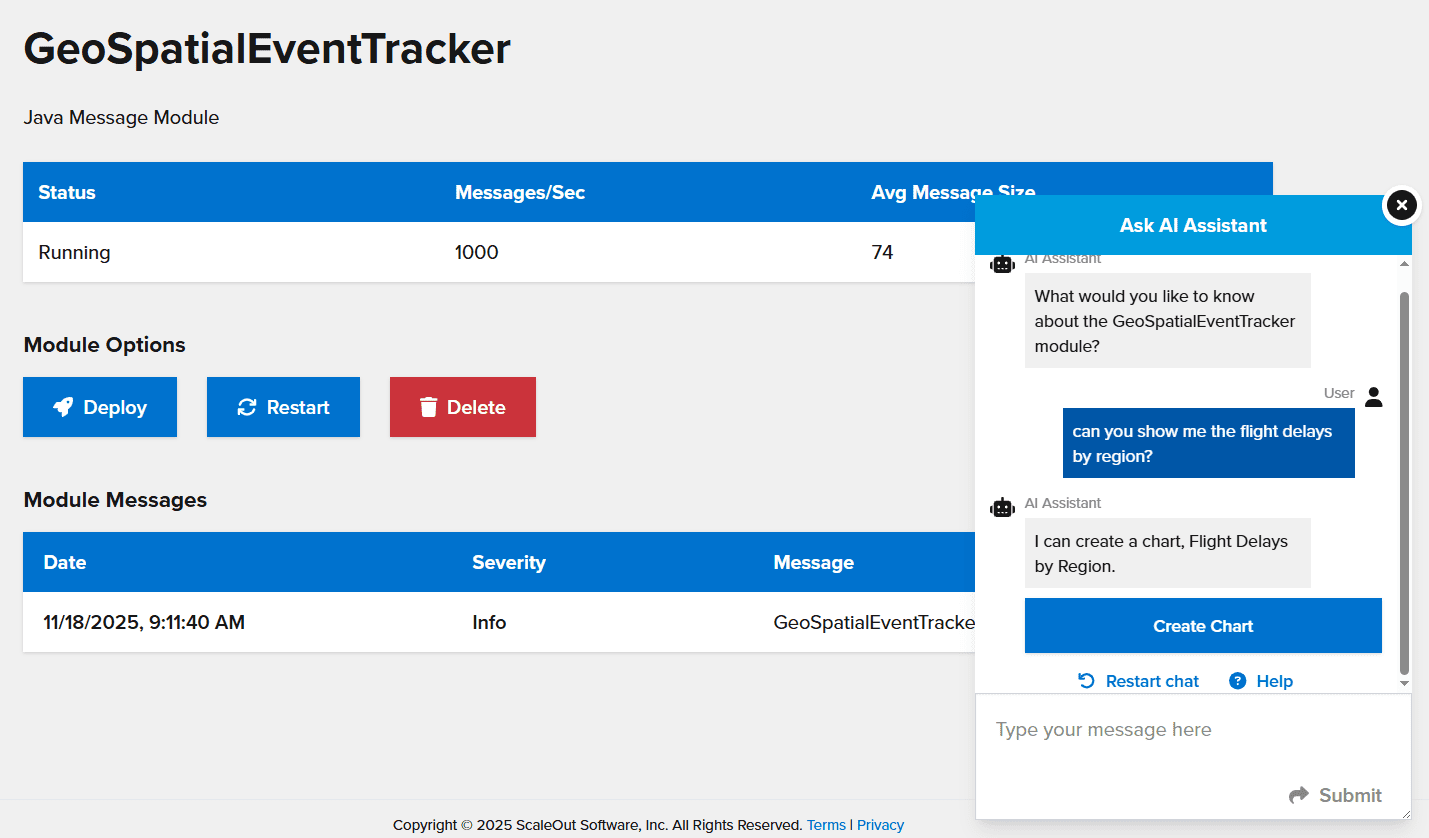
If the user has a question about the data or is not sure whether a query or a chart is best, no problem. The user can ask the AI Assistant an open-ended question, and the Assistant will suggest a query or chart that it can create. The Assistant will also indicate if the request is beyond the current abilities of the system and will suggest alternatives. Here is an example of a simple interaction with the AI Assistant:
The integration of generative AI is implemented with performance in mind. OpenAI API requests are made asynchronously in the background, so they don’t interrupt the flow of anything else users may be doing in the UI. Data is sent to OpenAI in an optimized format to minimize the number of tokens used.
Data accuracy is a critical concern when using generative AI systems for visualizing data. The UI takes steps to prevent AI hallucinations, which occur when a generative AI gives incorrect or outdated information in its responses. To avoid AI hallucinations, it uses structured data outputs and constrains responses to ensure AI-generated content is factually based on cached data.
Summing Up
By integrating gen AI into its management UI, ScaleOut Active Caching has taken a big step forward in visualizing live data. By enabling natural language prompts with feedback from an LLM, it enables non-technical managers to quickly and easily create charts and queries, spot emerging trends, and take action. This next generation in distributed caching does more than accelerate application performance. It enables users to gain important new insights into their fast-changing data so that they can react faster than previously possible.