The goal of real-time streaming analytics is to get answers fast. Mission-critical applications that manage large numbers of live data sources need to quickly sift through incoming telemetry, assess dynamic changes, and immediately pinpoint emerging issues that need attention. Examples abound: a telematics application tracking a fleet of vehicles, a vaccine distribution system managing the delivery of thousands of shipments, a security or safety application analyzing entry points in a large infrastructure (physical or cyber), a healthcare application tracking medical telemetry from a population of wearable devices, a financial services application watching wire transfers and looking for potential fraud — the list goes on. In all these cases, when a problem occurs (or an opportunity emerges), managers need answers now.
Conventional streaming analytics platforms are unable to separate messages from each data source and analyze them as they flow in. Instead, they ingest and store telemetry from all data sources, attempt a preliminary search for interesting patterns in the aggregated data stream, and defer detailed analysis to offline batch processing. As a result, they are unable to introspect on the dynamic, evolving state of each data source and immediately alert on emerging issues, such as the impending failure of a truck engine, an unusual pattern of entries and exits to a secure building, or a potentially dangerous pattern of telemetry for a patient with a known medical condition.
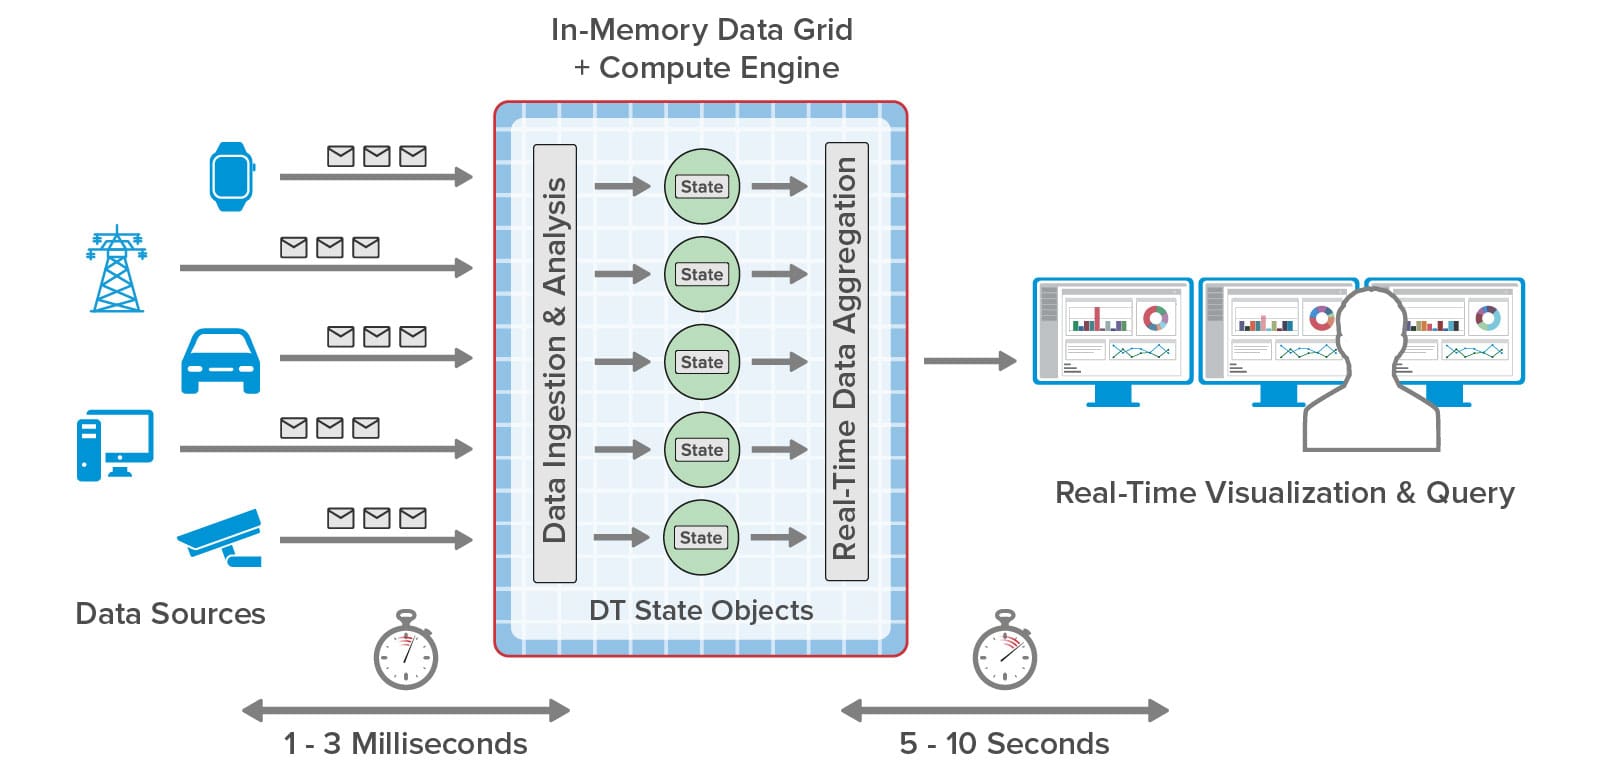
In-memory computing with software components called real-time digital twins overcomes these obstacles and enables continuous analysis of incoming telemetry for each data source with contextual information that deepens introspection. While processing each message in a few milliseconds, this technology automatically scales to simultaneously handle thousands of data sources. It also can aggregate and visualize the results of analysis every few seconds so that managers can graphically track the state of a complex live system and quickly pinpoint issues.
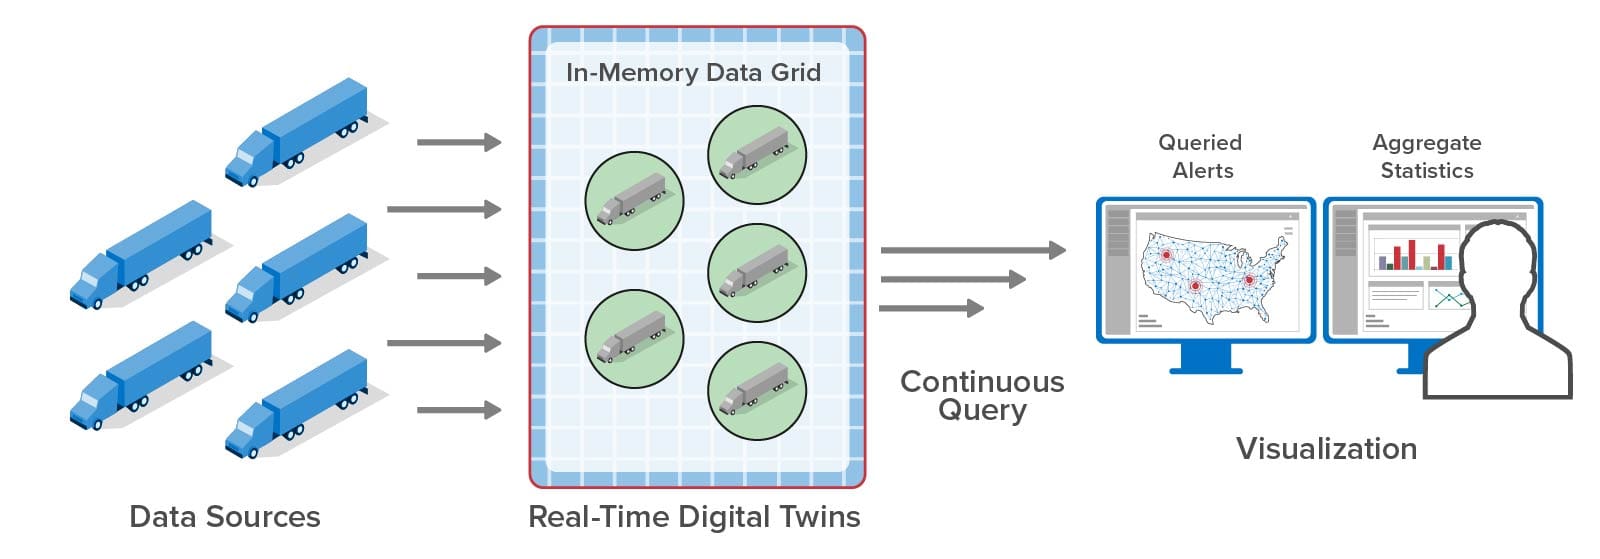
The ScaleOut Digital Twin Streaming Service™ is an Azure-based cloud service that uses real-time digital twins to perform continuous data ingestion, analysis by data source, aggregation, and visualization, as illustrated below. What’s key about this approach is that the system visualizes state information that results from real-time analysis — not raw telemetry flowing in from data sources. This gives managers curated data that intelligently focuses on the key problem areas (or opportunities). For example, instead of looking at fluctuating oil temperature, telematics dispatchers see the results of predictive analytics. There’s not enough time for managers to examine all the raw data, and not enough time to wait for batch processing to complete. Maintaining situational awareness requires real-time introspection for each data source, and real-time digital twins provide it.
In the ScaleOut Digital Twin Streaming Service, real-time data visualization can take the form of charts and tables. Dynamic charts effectively display the results of aggregate analytics that combine data from all real-time digital twins to show emerging patterns, such as the regions of the country with the largest delivery delays for a vaccine distribution system. This gives a comprehensive view that helps managers maintain the “big picture.” To pinpoint precisely which data sources need attention, users can query analytics results for all real-time digital twins and see the results in a table. This enables managers to ask questions like “Which vaccination centers in Washington state are experiencing delivery delays in excess of 1 hour and have seen more than 100 people awaiting vaccinations at least three times today?” With this information, managers can immediately determine where vaccine shipments should be delivered first.
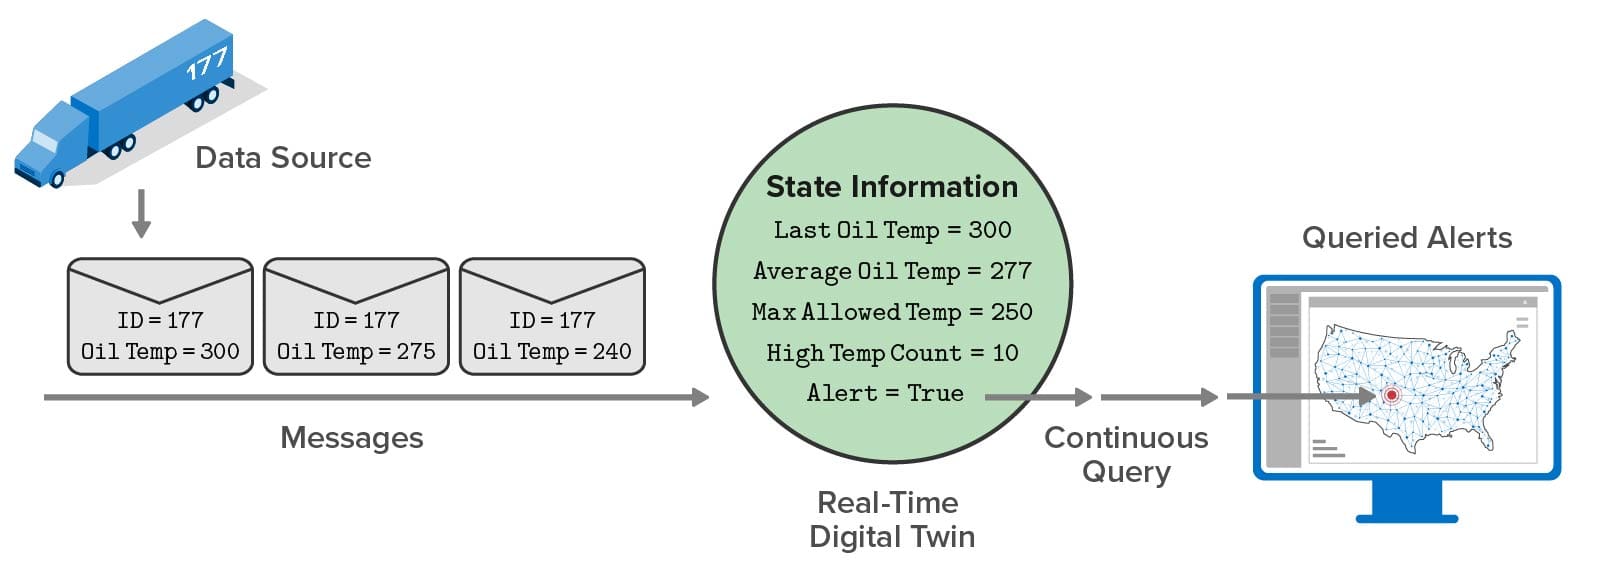
With the latest release, the streaming service now offers geospatial mapping of query results combined with continuous queries that refresh the map every few seconds. For example, using this cloud service, a telematics system for a trucking fleet can continuously display the locations of specific trucks which have issues (the red dots on the map) in addition to watching aggregate statistics:
For applications like this, a mapped view of query results offers valuable insights about the locations where issues are emerging that would otherwise be more difficult to obtain from a tabular view. Note that the queried data shows the results of real-time analytics which are continuously updated as messages arrive and are processed. For example, instead of displaying the latest oil temperature from a truck, the query reports the results of a predictive analytics algorithm that makes use of several state variables maintained by the real-time digital twin. This declutters the dispatcher’s view so that only alertable conditions are highlighted and demand attention:
The following image shows an example of actual map output for a hypothetical security application that tracks possible intrusions within a nationwide power grid. The goal of the real-time digital twins is to assess telemetry from each of 20K control points in the power grid’s network, filter out false-positives and known issues, and produce a quantitative assessment of the threat (“alert level”). Continuous queries map the results of this assessment so that managers can immediately spot a real threat, understand its scope, and take action to isolate it. The map shows the results of results three continuous queries: high alerts requiring action, medium alerts that just need watching, and offline nodes (with the output suppressed here):
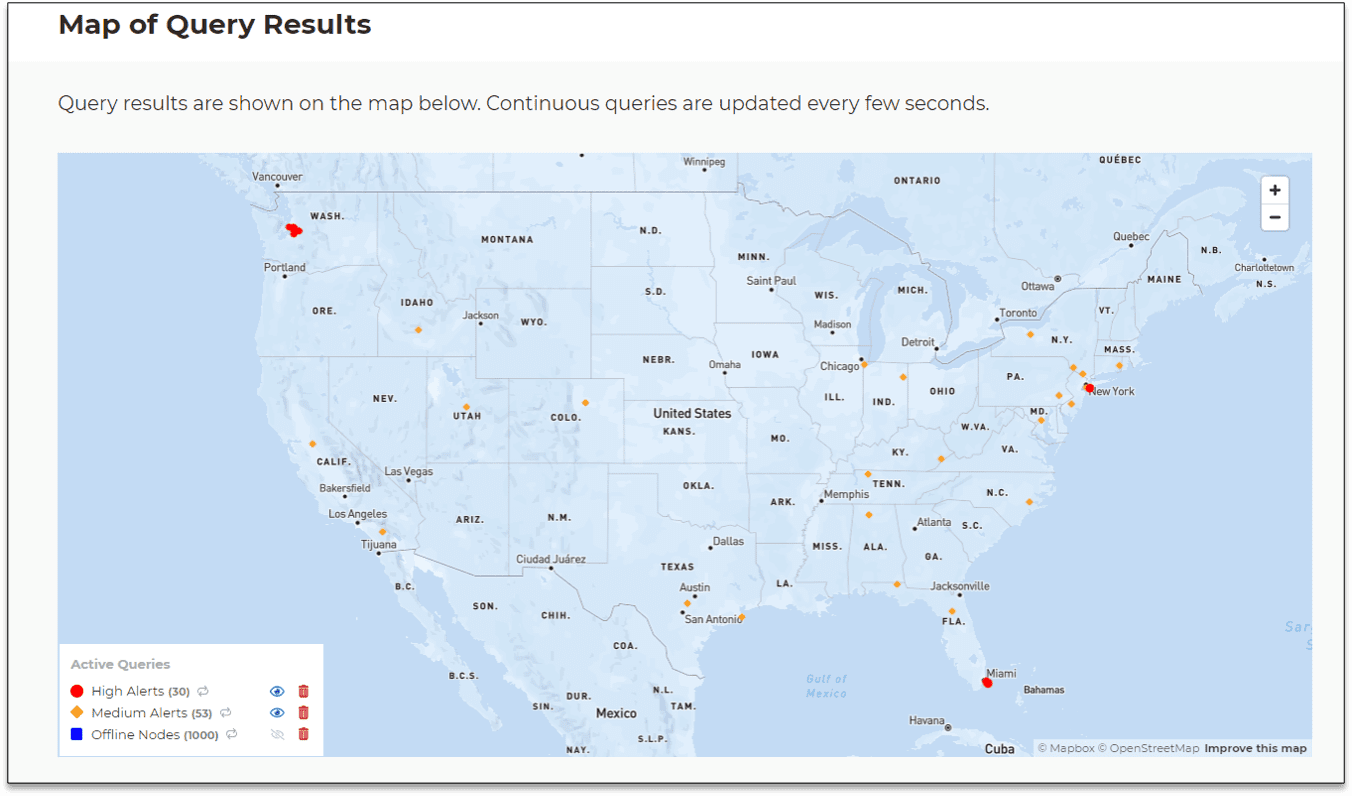
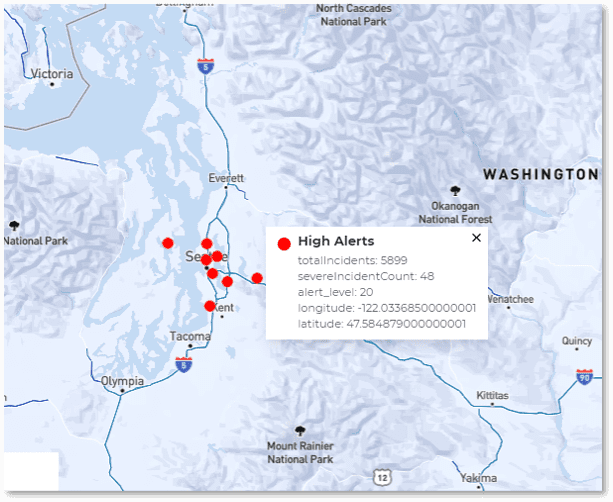
In this scenario a high alert has suddenly appeared in the grid at three locations (Seattle, New York, and Miami) indicating a serious, coordinated attack on the network. By zooming in and hovering over dots in the graph, users can display the detailed query results for each corresponding data source. Within seconds, managers have immediate, actionable information about threat assessments and can quickly visualize the locations and scope of specific threats.
In applications like these and many others, the power of in-memory computing with real-time digital twins gives managers a new means to digest real-time telemetry from thousands of data sources, combine it with contextual information that enhances the analysis, and then immediately visualize the results. This powerful technology boosts situational awareness and helps guide responses much better and faster than was previously possible.